
World Web Security Survey of 5 Million Sites — Final Report: Security Posture Across the Tranco Top 1M and 3.95M Common Crawl Domains
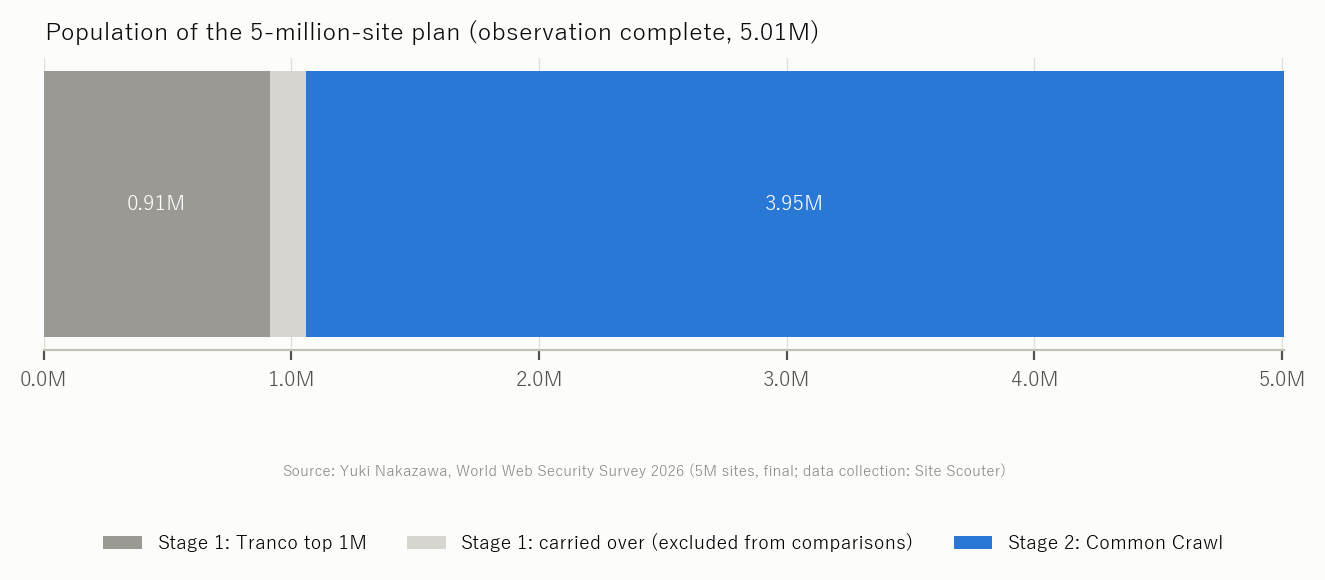
- Final report of a plan to observe 5 million websites worldwide with one identical method. Stage 1 (Tranco top 1 million and other lists, 1,057,185 domains) and stage 2 (3,949,993 domains from the Common Crawl domain ranking) were completed on 2026-10-29 03:38. The comparisons use the 911,485 Tranco-derived domains of stage 1 and the 3,949,993 domains of stage 2, 4,861,478 in total.
- Stage 2 reachability (DNS resolved and an HTTP response received) was 79.6% (stage 1: 85.3%). DNS failures were 14.4%: roughly one in ten names on the ranking no longer exists.
- Across the pooled 4,861,478 domains (3,922,585 responding), HTTPS enforcement is 95.1%, HSTS 29.3%, CSP 16.6%, X-Frame-Options 26.3%, version concealment 73.8% and WAF/CDN in front 38.7%. HTTPS has reached almost everywhere, while measures a site must configure deliberately stay at about three in ten for HSTS and under two in ten for CSP.
- Between the Tranco top 1 million and the 3.95 million Common Crawl domains, HSTS differs by -7.3 points, CSP by -11.6, X-Frame-Options by -19.8 and WAF/CDN in front by -15.3. The pattern seen at the 1-million mark in the interim report — measures that need configuration drop as the population widens — held across all 3.95 million.
- WordPress was identified on 25.4% of responding stage 2 sites (stage 1: 13.4%). 9.9% of stage 2 sites announce a PHP version and 44.6% of those are end-of-life versions. 9.8% of responding sites announce a version within a published CVE range (stage 1: 10.6%, upper bound).
- The open question from the interim report — why the Common Crawl 600k–1M band alone showed lower reachability and HSTS — was separated by failure type and observation time. DNS failures rise with rank, and the 1.6M–1.8M band holds a cluster of dead domains that still do not resolve when re-queried later through other resolvers (genuine disappearance). Connection and TLS failures were skewed by observation time, so the 255,894 affected hosts were re-observed before the final count (section 3).
Also published on the author's blog nkzw.jp. See the interim report for the 1-million-domain stage.
The survey and where this report sits
The survey observes 5 million websites worldwide for HTTPS, HSTS, security headers, TLS, certificates, server version disclosure and PHP support status, with the same method in the same period. It extends the earlier "Security Exposure Survey 2026" (10 regions, 260k sites) to world scale. The population was built in two stages.
- Stage 1: Tranco top 1 million (911,485 domains, 139 countries plus gTLDs), observed 2026-10-22 to 2026-10-28. Stage 1 also carried over 145,700 domains from the earlier survey (Japanese sites from search history and Majestic, among others); their population differs, so they are excluded from the comparisons here.
- Stage 2: the Common Crawl domain ranking, taking 3,949,993 registrable domains not in stage 1, in rank order (ranks 398 to 4,322,835), observed 2026-10-27 21:24 to 2026-10-29 03:38.
The interim report (28 October 2026) covered the first 1,002,874 stage 2 domains (ranks up to 1,256,831). This report keeps that range as the "interim-report range" and shows how it differs from the full set (section 5). The ICANN CZDS (zone file) request is still pending, so no zone-file population is included; if approved and observed later, it will be reported separately as stage 3.
Method
Each site receives one DNS lookup, one TLS handshake and one HTTP GET: the same as opening the site once in a browser. No port scanning, vulnerability probing, authentication attempts or exploit traffic. Observation runs from workers spread across several domestic connections; one hub server hands out a queue and collects results into an append-only table.
- De-duplication: where a host was observed more than once, the latest row that is not a DNS failure is used, otherwise the latest row.
- Common Crawl rank: the harmonic-centrality rank from the domain-level web graph of
cc-main-2026-jul-aug-sep. Tranco is a "popularity" order that merges several ranking sources; the Common Crawl rank measures centrality in the link graph reached by the crawl, which is not the same as popularity. - Stage 1 scanners: stage 1 switched its worker implementation from PHP to Python part-way through, so some failure labels differ. Reachability and adoption definitions are identical.
- Metric definitions follow the Security Exposure Survey 2026: HTTPS enforced = an HTTP request is redirected to HTTPS; HSTS = the response carries
Strict-Transport-Security; version concealed = no version number inServerorX-Powered-By; CVE exposure = the announced version falls inside the affected range of a published CVE (upper bound). - Pooled values: "pooled" means the 911,485 Tranco-derived and 3,949,993 Common Crawl domains added together without weighting. Common Crawl makes up about 80%, so pooled values sit close to stage 2.
Reachability — one in ten ranked names is gone
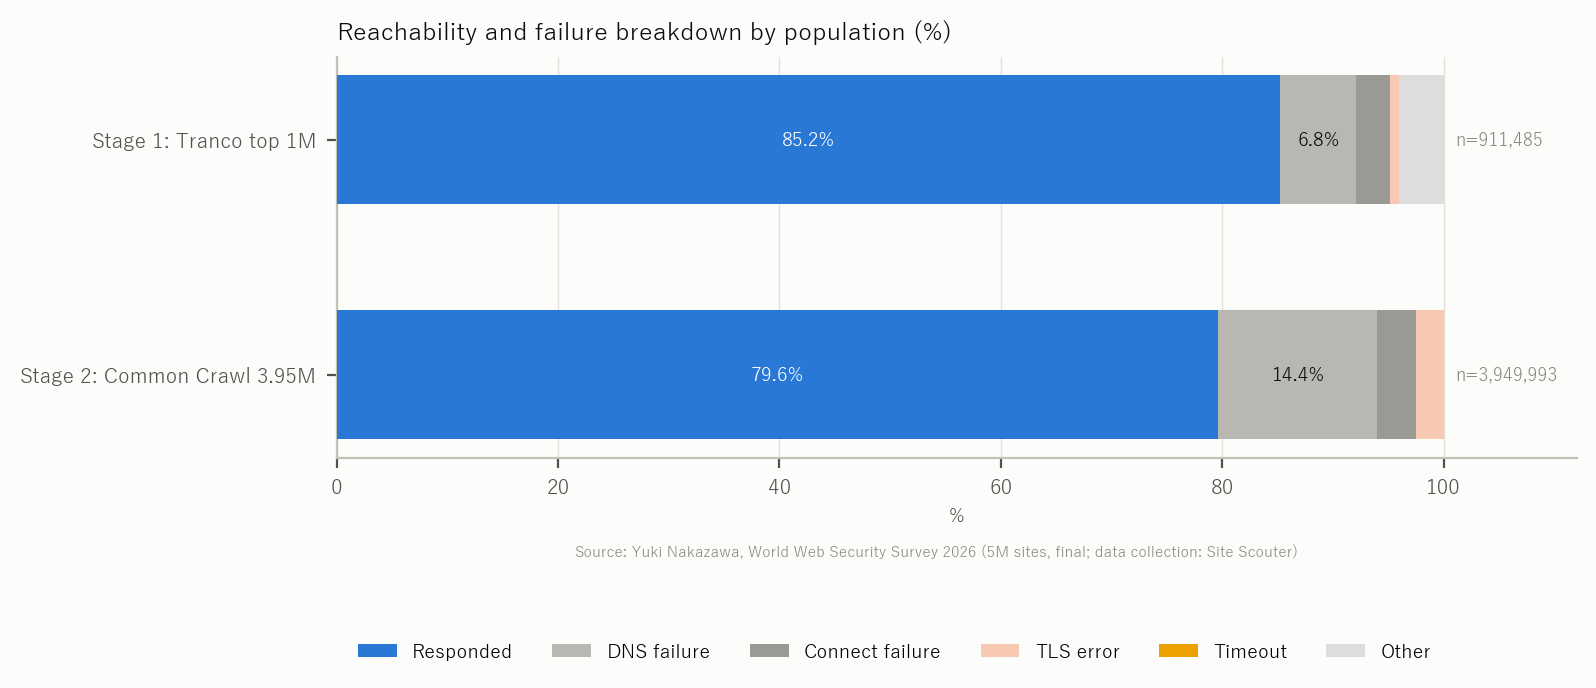
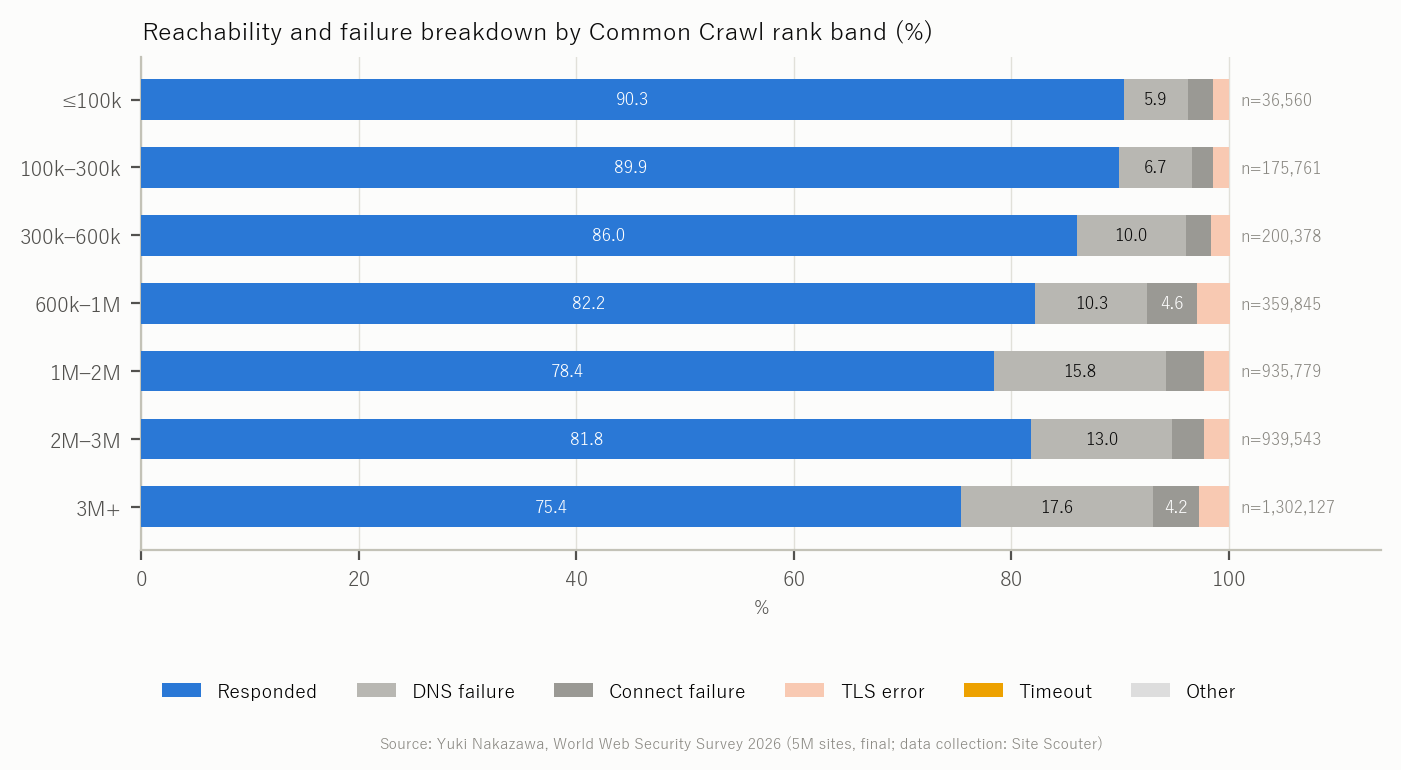
Of the 3,949,993 stage 2 domains, 3,145,094 (79.6%) returned an HTTP response. DNS failures were 14.4%, connection failures 3.5%, and TLS errors 2.5%. Stage 1 reached 85.3% with 6.8% DNS failures (Figure 1).
By rank band, Tranco reaches fewer sites in its top 100k (80.8%) than at 600k–1M (87.7%): the top of the list holds many CDN delivery domains and API hostnames that are not browser-facing sites. Common Crawl reaches 90.3% in the top 100k, 82.2% at 600k–1M, 78.4% at 1M–2M, 81.9% at 2M–3M and 75.5% beyond 3M (Figure 2).
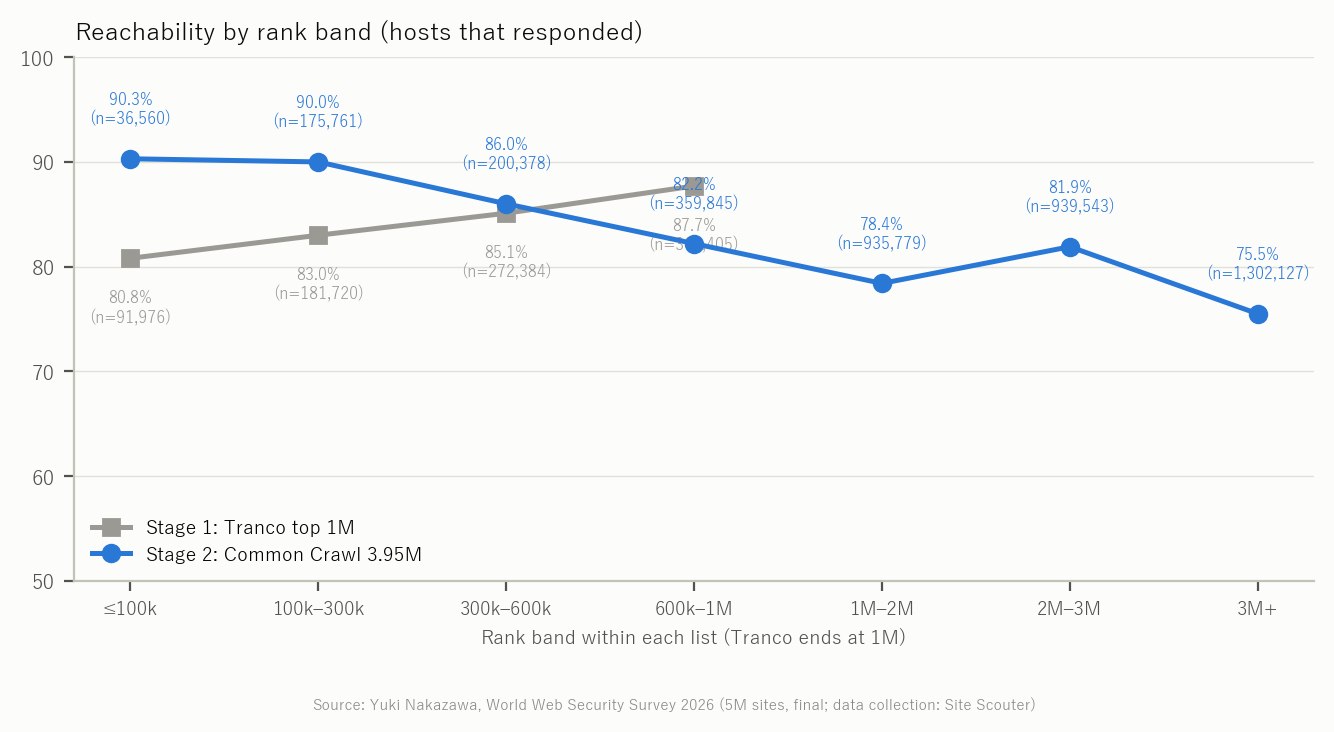
The interim report left open why the 600k–1M band alone was lower. Separating failures by type and observation time (Figure 13) gives two answers. DNS failures, the largest category, rise with rank (6.8% in the top 200k, 25.8% beyond 4M): a property of the population, with more dead domains further down. They are not uniform, though: the 200k domains at ranks 1.6M–1.8M alone showed 35% DNS failures. Re-querying a sample of those failed hosts later through other resolvers (1.1.1.1 and 8.8.8.8, with and without www) resolved none of them: a cluster of dead domains sits together in the ranking. Older domains that were central in link networks remain ranked after the sites are gone.
Connection failures and TLS errors, on the other hand, were skewed by observation time. The 600k–1M band (first observed 28 October 00:00–02:23) showed 4.1% connection failures and 4.1% TLS errors on that first pass, about twice the neighbouring bands (2–3%), and other bands observed in the same hours showed the same rise, which points to a transient problem on some of the observation lines. Every Common Crawl host that ended in a connection or TLS failure was therefore re-observed before the final count, and the figures in this report include those results. Only a small share of those hosts answered on the second pass, however. The 600k–1M band moved from 81.6% to 82.2% reachable, and connection plus TLS failures from 8.2% to 4.6% + 3.0%, which now sits between the neighbouring bands (86.0% and 78.4%). The observation-side problem explains only part of the excess; most of the failures were hosts that genuinely did not answer. HSTS, on the other hand, stays the lowest of all bands at 23.4% (neighbours: 33.4% and 27.3%), and since HSTS is computed over reachable sites only, reachability does not explain it. Something in that band's population is skewed, but this report could not identify what.
Adoption of security measures — what changed and what did not
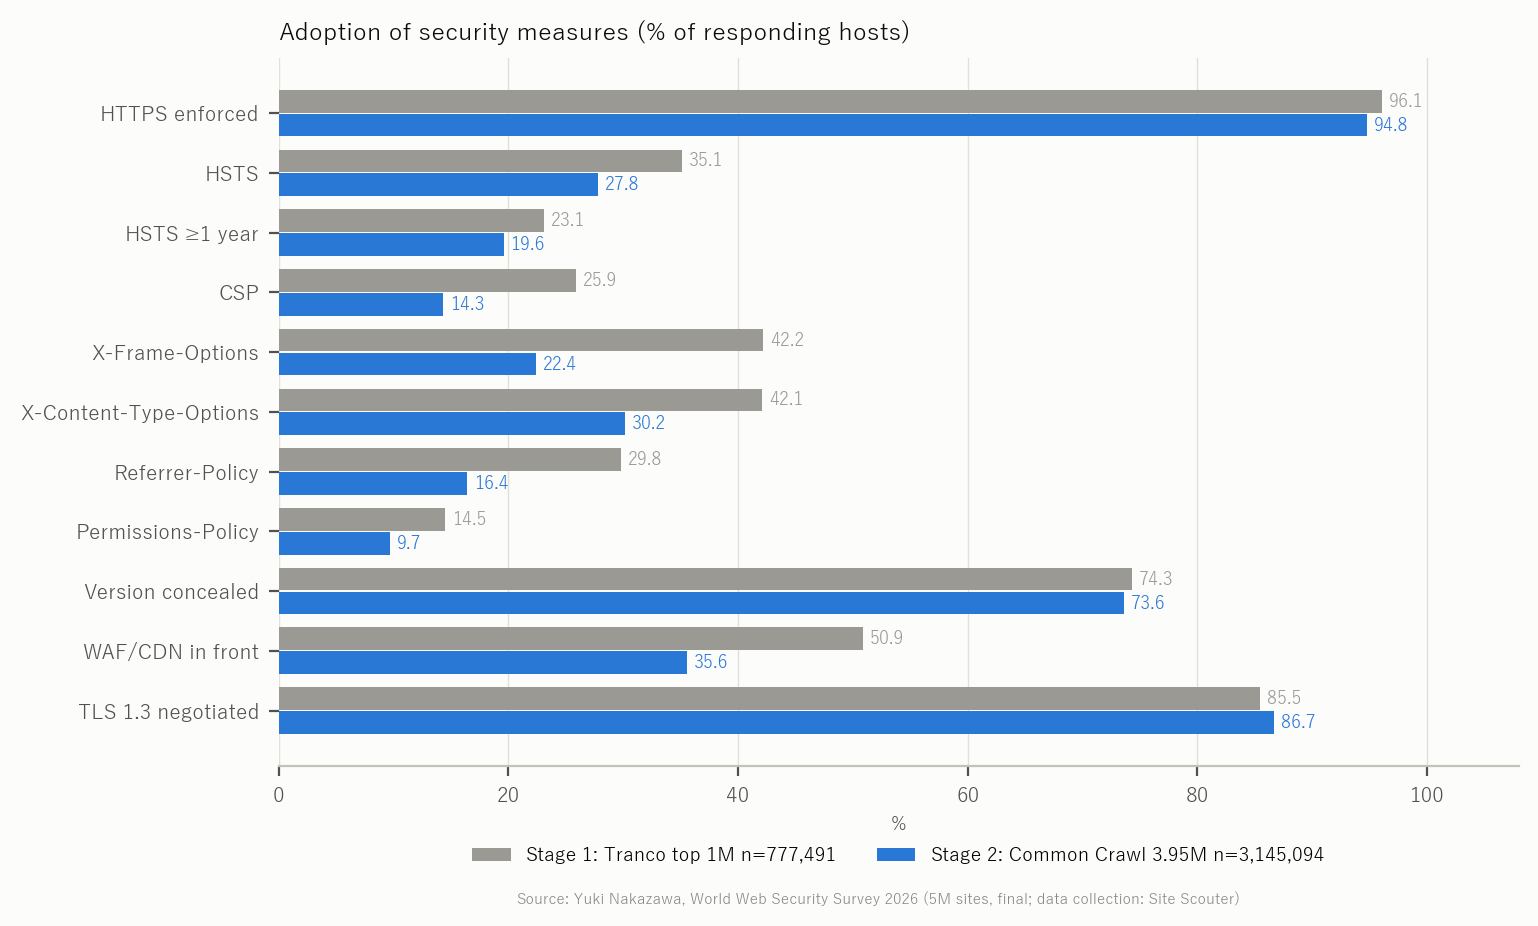
Figure 3 and the table show adoption as a share of responding sites. "Pooled" is the simple sum of Tranco and Common Crawl.
| Measure | Stage 1 Tranco (n=777,491) | Stage 2 Common Crawl (n=3,145,094) | Diff. | Pooled (n=3,922,585) |
|---|---|---|---|---|
| HTTPS enforced | 96.1% | 94.8% | -1.3 | 95.1% |
| HSTS | 35.1% | 27.8% | -7.3 | 29.3% |
| HSTS (max-age ≥ 1 year) | 23.1% | 19.6% | -3.5 | 20.3% |
| CSP | 25.9% | 14.3% | -11.6 | 16.6% |
| X-Frame-Options | 42.2% | 22.4% | -19.8 | 26.3% |
| X-Content-Type-Options | 42.1% | 30.2% | -11.9 | 32.6% |
| Referrer-Policy | 29.8% | 16.4% | -13.4 | 19.1% |
| Permissions-Policy | 14.5% | 9.7% | -4.8 | 10.7% |
| Version concealed | 74.3% | 73.6% | -0.7 | 73.8% |
| WAF/CDN in front | 50.9% | 35.6% | -15.3 | 38.7% |
| TLS 1.3 negotiated | 85.5% | 86.7% | +1.2 | 86.4% |
HTTPS enforcement is nearly identical across the two populations: HTTPS has reached well beyond the top of the rankings. The gaps appear in measures a site has to configure deliberately: HSTS (-7.3 points), CSP (-11.6 points), X-Frame-Options (-19.8 points), Referrer-Policy (-13.4 points) and the share of sites behind a WAF/CDN (-15.3 points). The WAF/CDN gap is explained by Cloudflare appearing in the Server header of 42.8% of stage 1 sites but only 29.1% of stage 2 sites. A front-end such as Cloudflare adds some headers without any action by the site, so when the front-end share falls, header adoption falls with it.
Among sites that set a cookie (879,428 in stage 2), Secure was present on 68.0%, HttpOnly on 59.5% and an explicit SameSite on 48.2% (stage 1: 64.5% / 67.9% / 57.8%).
What moved since the interim report (1-million mark)
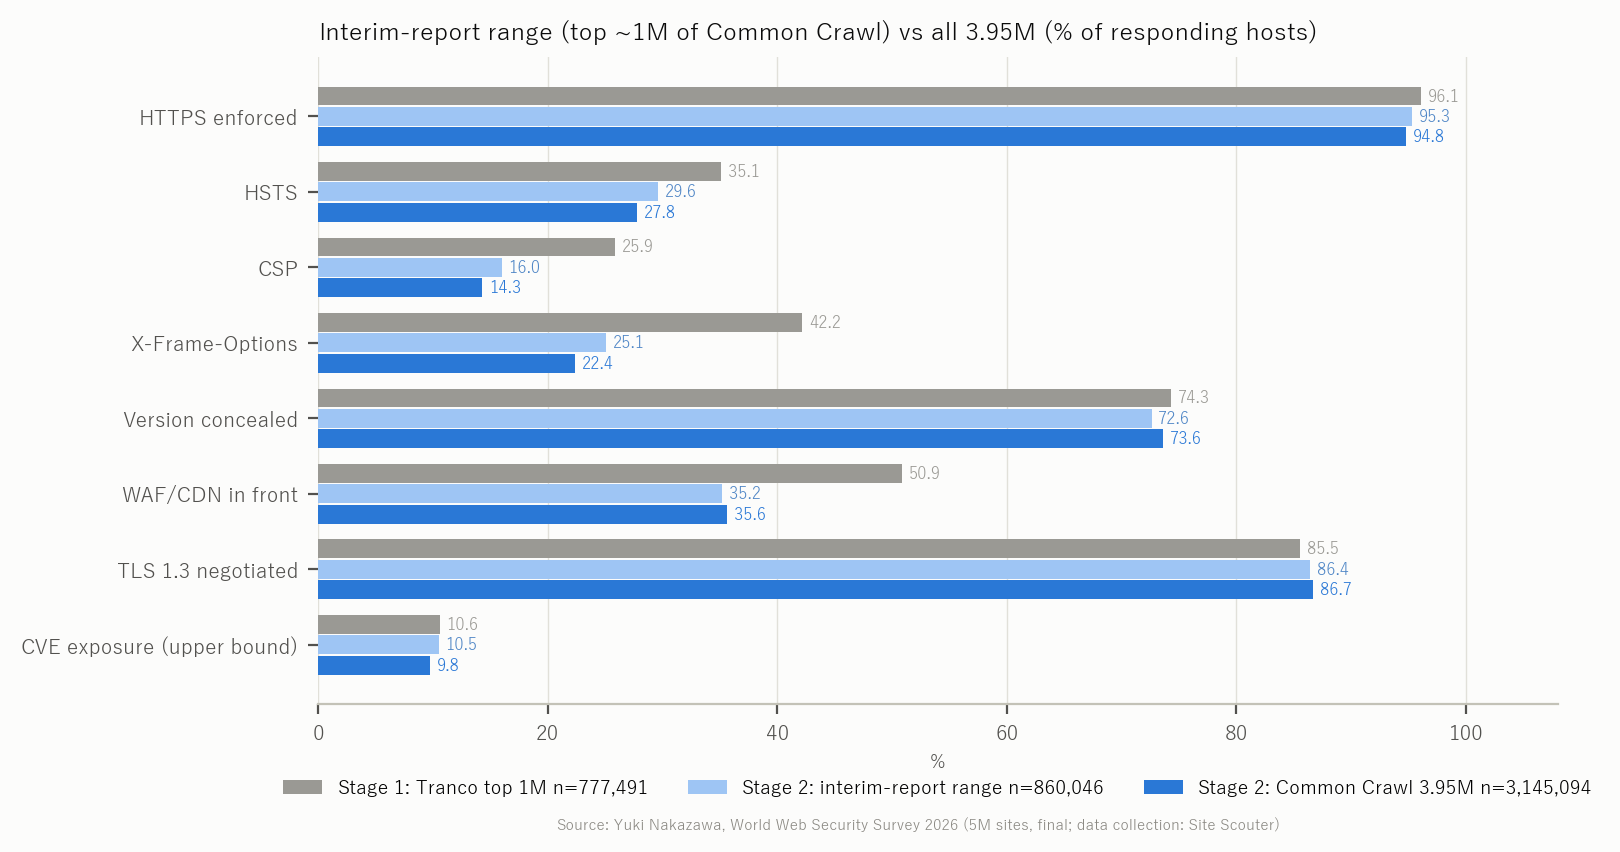
The interim report covered the first 1,002,874 Common Crawl domains (ranks up to 1,256,831). Placing that range next to the full set: reachability 85.8% → 79.6%, HTTPS enforced 95.3% → 94.8%, HSTS 29.6% → 27.8%, CSP 16.0% → 14.3%, WAF/CDN in front 35.2% → 35.6%, version concealed 72.6% → 73.6%, CVE exposure 10.5% → 9.8% (Figure 12). Adding the remaining 2.95 million domains moved adoption rates by only a few points, and the interim reading stands. What moved was reachability, because dead domains become more common further down the ranking.
Does adoption fall with rank? The two rankings differ
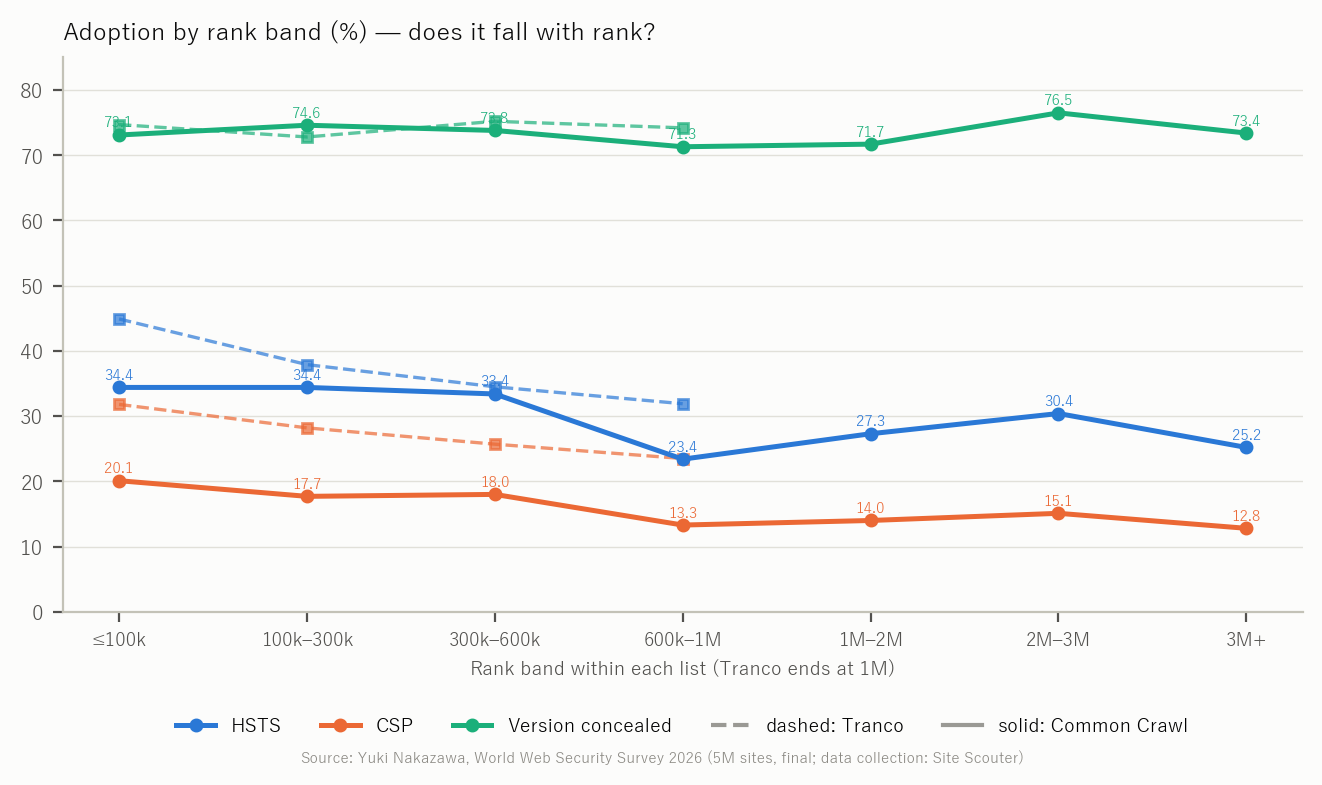
In Tranco, HSTS and CSP fall as rank falls: HSTS from 44.9% in the top 100k to 31.9% at 600k–1M, CSP from 31.8% to 23.5%. That is the intuitive pattern: the more a site is used, the more likely it is hardened.
Across Common Crawl rank bands, HSTS is 34.4% in the top 100k, 34.4% at 100k–300k, 33.4% at 300k–600k, 23.4% at 600k–1M, 27.3% at 1M–2M, 30.4% at 2M–3M and 25.2% beyond 3M. CSP goes from 20.1% in the top 100k to 12.8% beyond 3M, falling overall with ups and downs in between (Figure 4). HSTS is flat at around 34% down to rank 600k and then moves between 23% and 31% from band to band, with none of the one-directional slope seen in Tranco. Harmonic centrality measures how easily a domain is reached by links from many pages, which is not the same as having many users. Directory-style sites with dense mutual links and older sites with link lists rank high, forming a population distinct from a popularity order.
TLS and certificates
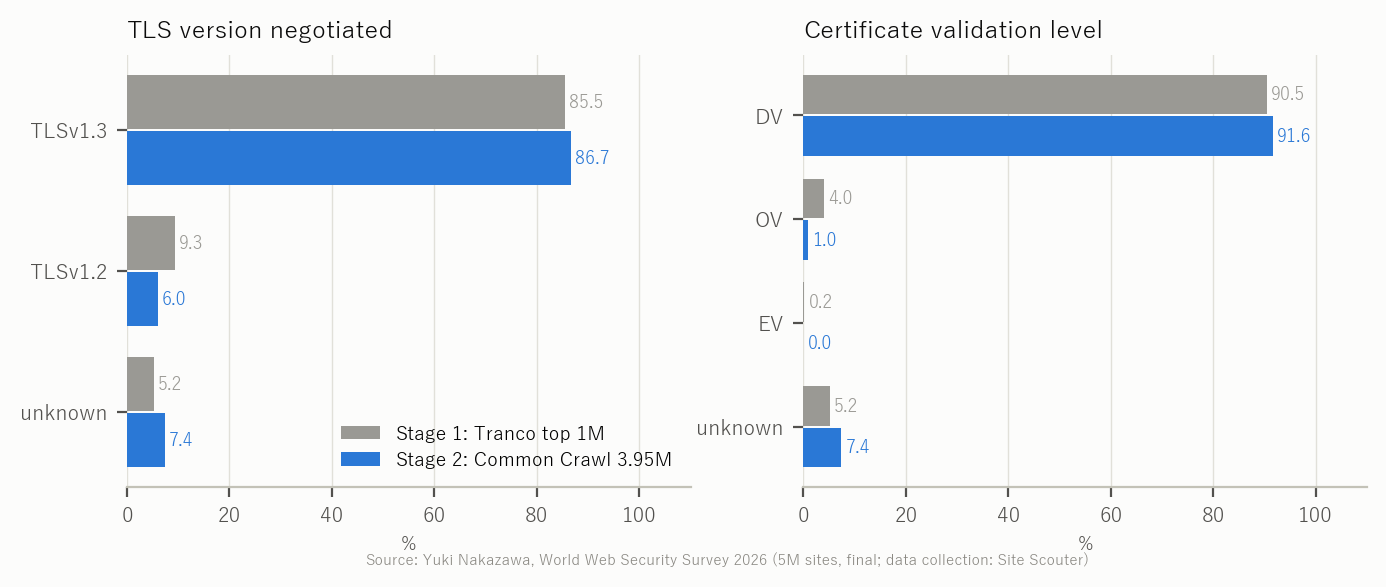
Stage 2 negotiated TLS 1.3 on 86.7% of responding sites and TLS 1.2 on 6.0% (stage 1: 85.5% / 9.3%; pooled: 86.4% / 6.6%). With this method a site that only speaks TLS 1.0/1.1 fails to connect and cannot be told apart from other failures. In stage 2, DV certificates were 91.6%, OV 1.0% (stage 1 OV 4.0% / EV 0.2%; the stage 2 scanner did not detect EV, so stage 1 EV is not directly comparable). The wider the population, the smaller the OV share and the larger the share of sites running on free DV certificates (Figure 5).
Server products and version disclosure
In stage 2 the Server header named Cloudflare on 29.1%, nginx on 19.0%, Apache on 19.5% and LiteSpeed on 5.2% of responding sites (stage 1: Cloudflare 42.8%, nginx 18.3%, Apache 12.2%, LiteSpeed 2.7%). Widening the population lowers Cloudflare and raises Apache and LiteSpeed — the profile of shared hosting. A version number was included by 20.3% of nginx, 15.0% of Apache and 99.9% of IIS sites (IIS announces its version by default).
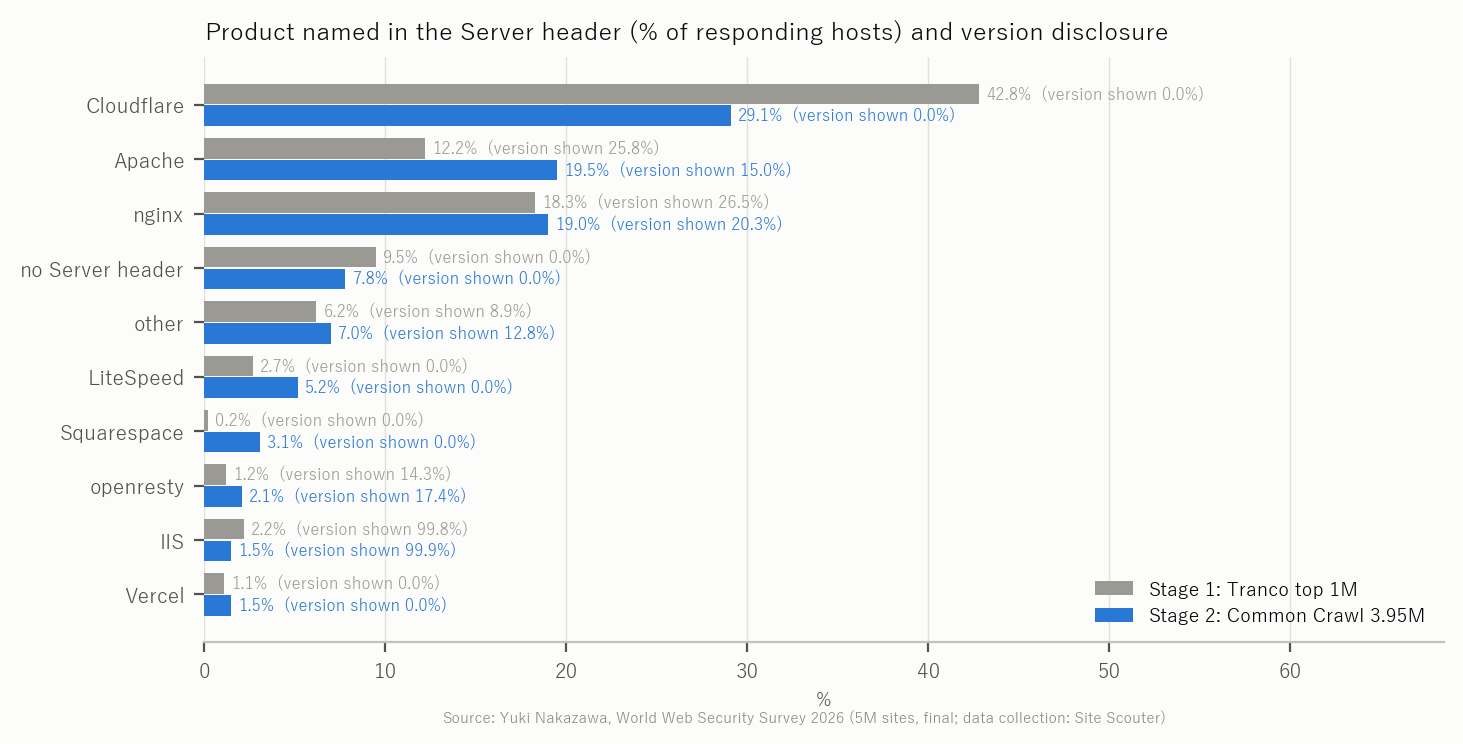
WordPress was identified on 25.4% of responding stage 2 sites (stage 1: 13.4%; pooled: 23.0%): widening the population raises the WordPress share considerably. Shopify fell from 3.8% in stage 1 to 1.0%.
WordPress and PHP versions together
Among sites identified as WordPress, 20.4% (163,110) announce a PHP version in stage 2, more than the 6.3% of non-WordPress sites. Of the announced versions, 38.4% are end of life on WordPress sites against 51.4% elsewhere: lower on WordPress. WordPress itself requires recent PHP and its dashboard warns about unsupported versions, which appears to push PHP updates along. The reverse holds for headers: WordPress sites show HSTS 20.5%, CSP 11.6% and version concealment 71.1%, below the 30.3%, 15.2% and 74.5% of other sites. PHP gets updated; header configuration is left as server-side work. In stage 1, 28.7% of PHP-disclosing WordPress sites were end of life.
| Stage 2 (Common Crawl), responding sites | WordPress | Not WordPress |
|---|---|---|
| Sites | 798,067 | 2,347,027 |
| Announce a PHP version | 20.4% | 6.3% |
| of which end of life | 38.4% | 51.4% |
| of which within a published CVE range (upper bound) | 47.4% | 57.4% |
| HSTS | 20.5% | 30.3% |
| CSP | 11.6% | 15.2% |
| Version concealed | 71.1% | 74.5% |
PHP versions and support status
9.9% of responding stage 2 sites (310,928; stage 1: 6.8%) announce a PHP version in X-Powered-By or similar. Of the announced versions, 44.6% (138,528 sites; stage 1: 48.5%) are end of life (PHP 8.1 or earlier). 27,526 sites still run PHP 5 and 76,717 run PHP 7. 42,926 announce 8.2 (security fixes only until 31 December 2026) and 129,445 announce 8.3 or later (Figure 7). Pooled, 45.1% (164,150) of the 363,719 PHP-disclosing sites are end of life.
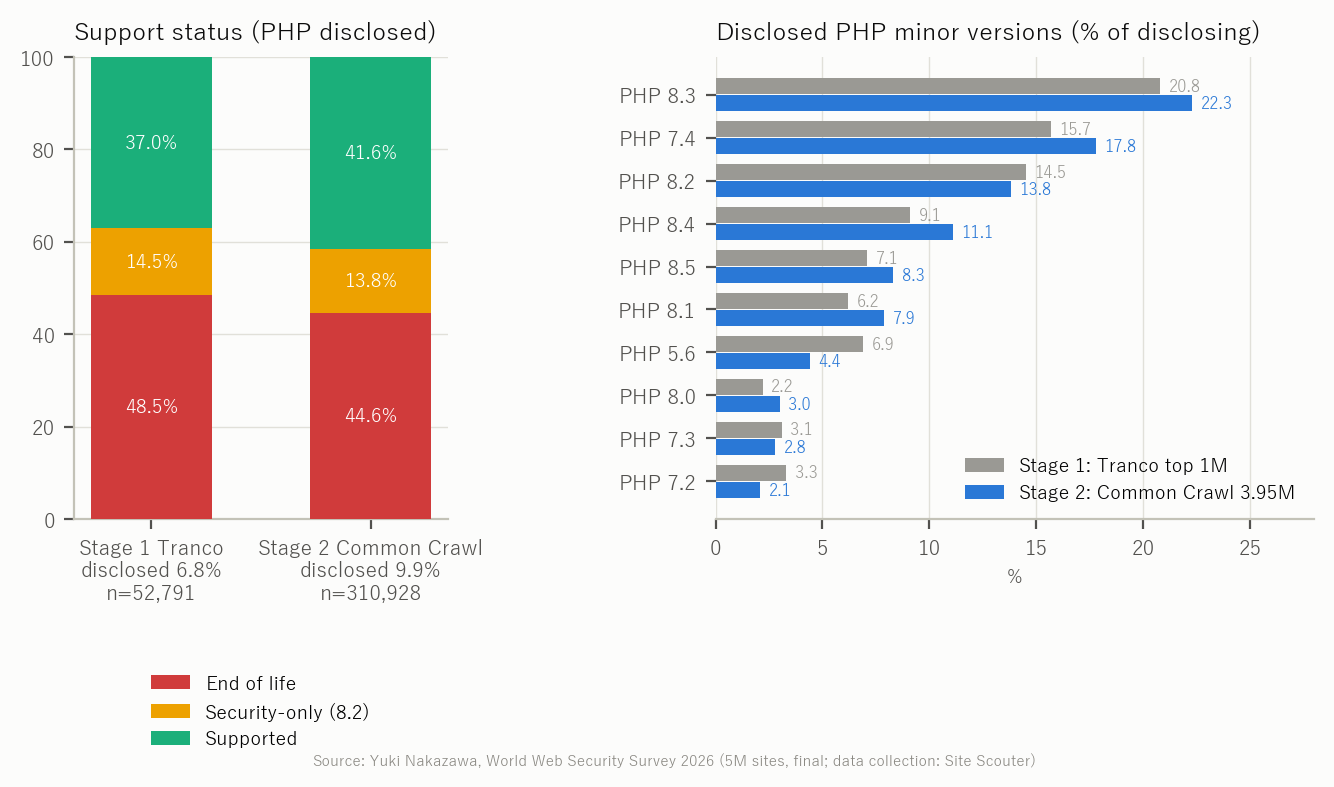
Version disclosure rose while the end-of-life share fell. Both the spread of PHP version switching on shared hosting and the number of environments that do not hide the version by default appear to contribute. Announcing a version is not a vulnerability in itself, but announcing an end-of-life version tells attackers where to look.
CVE exposure (upper bound)
9.8% of responding stage 2 sites (309,323) announce a version that falls within the affected range of a published CVE. 4.0% include a remote-code-execution class CVE and 7.9% include a CRITICAL one. Stage 1 was 10.6% / 3.3% / 7.4% and the pooled values are 10.0% / 3.8% / 7.8% (Figure 8). Going from 1 million to 5 million sites barely moved this level.
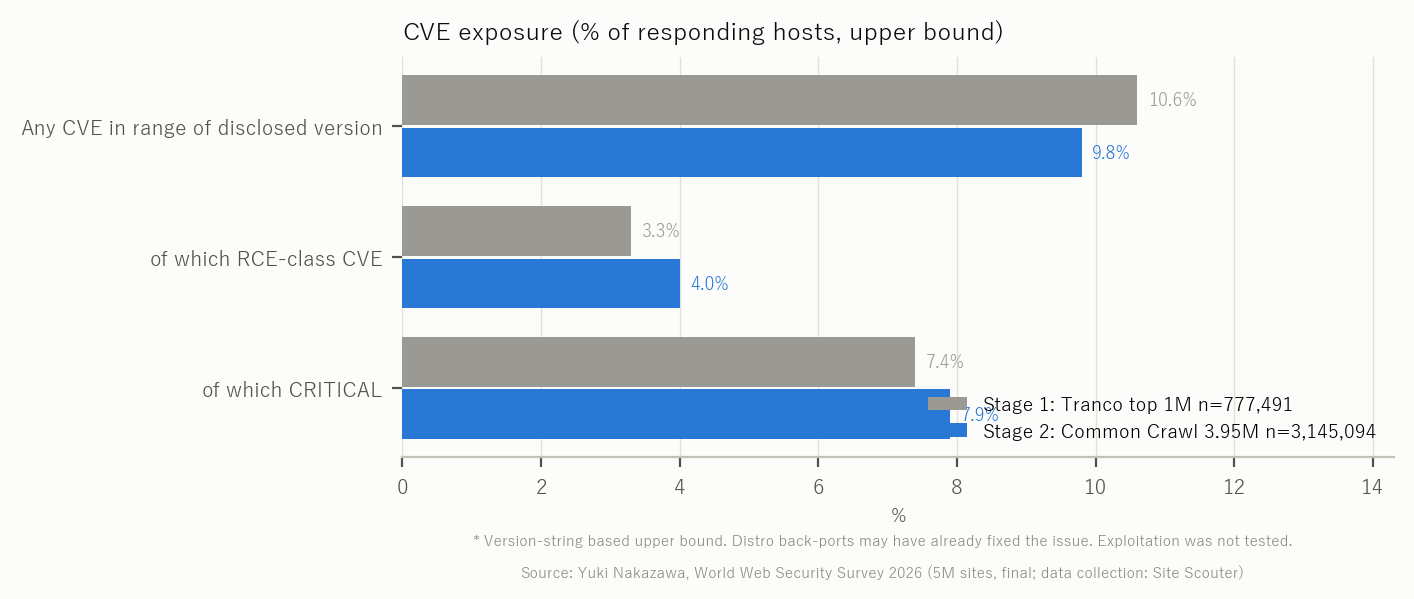
By product, 52.2% of sites announcing a PHP version, 87.1% of those announcing Apache and 54.1% of those announcing nginx were within a published CVE range. These are upper bounds based on the version string; distributions such as Debian and RHEL back-port fixes without changing the version number, which cannot be reflected. Exploitation was not tested. The most common RCE-class match, CVE-2024-3566, mostly concerns PHP-CGI on Windows and usually does not apply to Linux shared hosting.
Baseline score
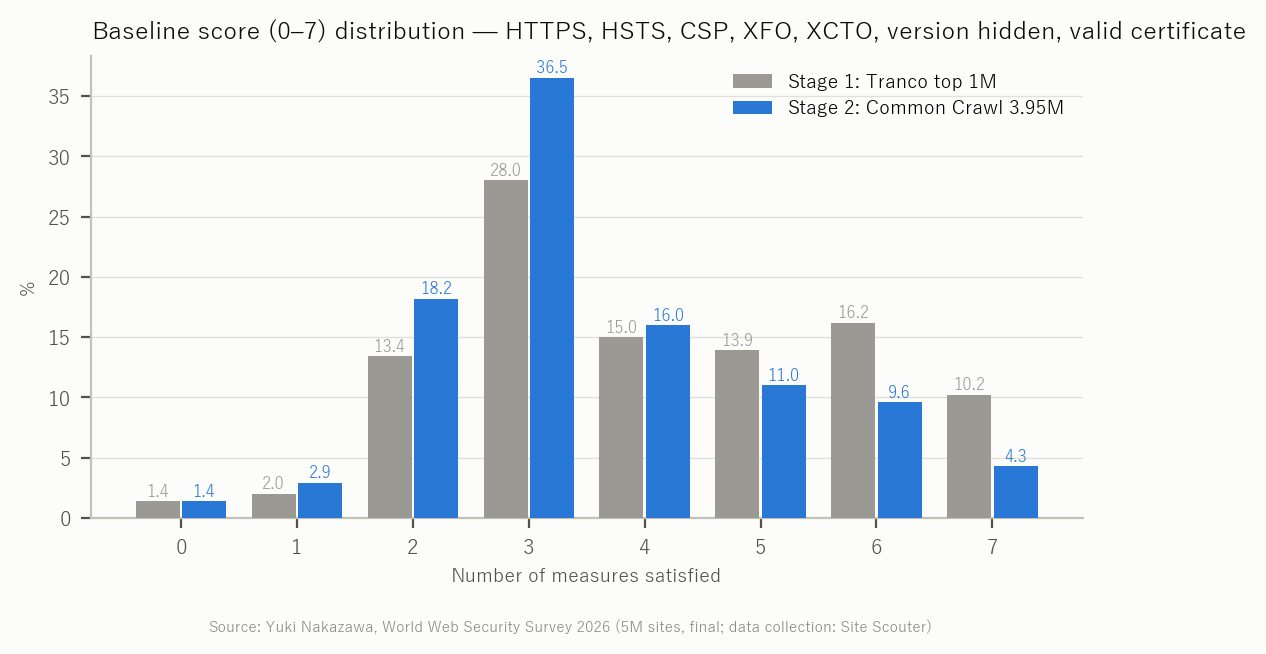
Seven items — HTTPS enforced, HSTS, CSP, X-Frame-Options, X-Content-Type-Options, version concealed and a valid certificate — give a 0–7 score. The stage 2 mean is 3.56 (stage 1: 4.10; pooled: 3.67). Stage 2 concentrates at 3 points (36.5%), and a full 7 is reached by only 4.3% (stage 1: 10.2%) (Figure 9). The most common shape is "HTTPS, certificate and version hiding done; headers untouched".
By TLD
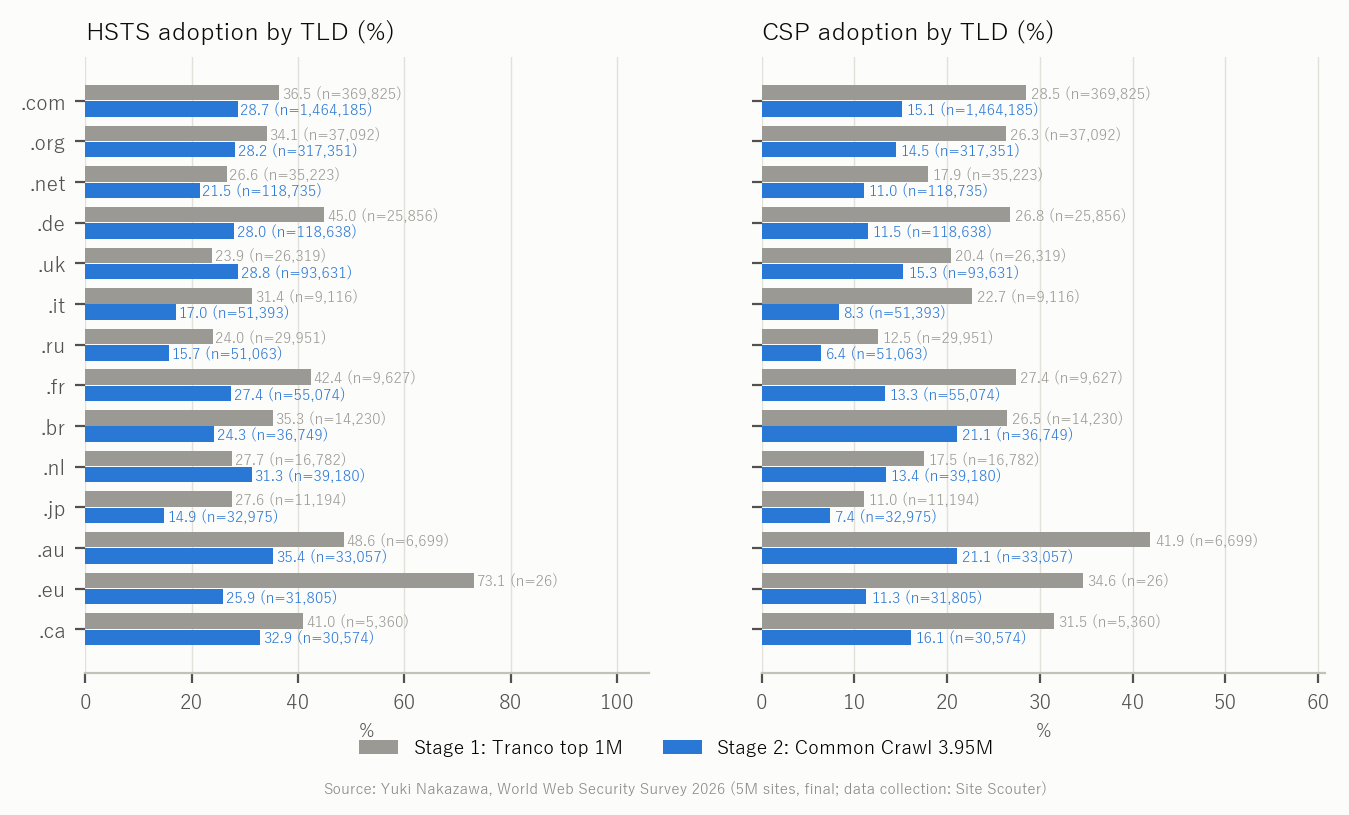
Figure 10 compares HSTS and CSP adoption for the TLDs most common in the Common Crawl population against the same TLDs in stage 1. .jp sits at HSTS 14.9% and CSP 7.4% in stage 2 (stage 1: 27.6% / 11.0%), which together with .ru (HSTS 15.7% / CSP 6.4%) is the lowest among the major TLDs. .de fell from 45.0% to 28.0% HSTS. Newer gTLDs such as .io and .app show high HSTS adoption in both stages.
Pooled values (Tranco + Common Crawl) for the major TLDs:
| TLD | Observed | Reachable | HTTPS enforced | HSTS | CSP | Version concealed | WAF/CDN in front | CVE exposure (upper bound) |
|---|---|---|---|---|---|---|---|---|
| .com | 2,246,846 | 81.6% | 94.9% | 30.3% | 17.8% | 75.4% | 43.4% | 8.3% |
| .org | 421,932 | 84.0% | 95.2% | 28.8% | 15.7% | 75.1% | 41.0% | 8.9% |
| .net | 210,036 | 73.3% | 93.8% | 22.7% | 12.6% | 73.4% | 36.7% | 11.2% |
| .de | 167,235 | 86.4% | 96.4% | 31.0% | 14.3% | 74.9% | 16.9% | 10.7% |
| .ru | 105,807 | 76.6% | 91.6% | 18.8% | 8.6% | 52.3% | 13.3% | 28.5% |
| .uk | 146,047 | 82.1% | 95.9% | 27.8% | 16.4% | 77.4% | 48.9% | 7.3% |
| .jp | 60,095 | 73.5% | 96.1% | 18.2% | 8.3% | 80.2% | 18.0% | 10.2% |
| .fr | 78,518 | 82.4% | 93.9% | 29.6% | 15.4% | 68.0% | 23.8% | 13.3% |
| .it | 85,971 | 70.4% | 94.5% | 19.2% | 10.5% | 70.2% | 23.4% | 11.9% |
| .nl | 62,549 | 89.5% | 96.7% | 30.2% | 14.6% | 70.7% | 36.4% | 13.7% |
The "whole web" level seen across 5 million sites
The pooled 4,861,478 domains (3,922,585 responding) give a reference level for the web as a whole: HTTPS enforced 95.1%, HSTS 29.3%, CSP 16.6%, X-Frame-Options 26.3%, X-Content-Type-Options 32.6%, version concealed 73.8%, WAF/CDN in front 38.7%, TLS 1.3 86.4%, CVE exposure (upper bound) 10.0%, mean baseline score 3.67.
This is a simple sum in which Common Crawl makes up about 80%. The Tranco top 1 million alone (HSTS 35.1%, CSP 25.9%) is a fair level for widely used sites but reads high as a level for the web as a whole. Conversely, HTTPS enforcement, TLS 1.3 and CVE exposure hardly moved as the population widened. HTTPS and TLS upgrades are measures that advance on the hosting provider's side; HSTS and CSP are measures a site operator sets up. What 5 million sites make visible is the gap between those two kinds of measures.
Limits and caveats
- The stage 2 population follows Common Crawl harmonic-centrality rank, not popularity. Do not read "top N" as in Tranco.
- Reachability is from the observation points (domestic connections); sites that did not respond because of geo-restrictions or bot protection count as failures. Stage 2 connection and TLS failures were re-observed; DNS failures were not (a sample check confirmed the names are gone).
- Stage 1 changed scanner implementation part-way, so some failure labels differ. Reachability and adoption definitions are the same.
- CVE exposure is an upper bound based on version strings and cannot reflect back-ported fixes. Exploitation was not tested.
- Pooled values are unweighted sums.
- No zone-file (ICANN CZDS) population is included.
- No individual site is named in this report.
Use the same non-intrusive method as this survey to see what your server announces: TLS, HSTS, headers and versions. No registration needed.
Use: Server information checkFAQ
Is this an attack?
No. Each site received the same access as opening it once in a browser, and only public HTTP responses and DNS data were used. No port scanning or vulnerability probing was performed.
Why Common Crawl?
Tranco stops at 1 million. Reaching 5 million needs a large, public, reproducible list. The Common Crawl domain ranking needs no application, anyone can download the same file, and it is limited to names the crawl actually reached, which makes it closer to "public websites" than a zone file.
Can the two populations be added into a "world average"?
Their nature differs, so they are shown separately, and section 14 also gives the unweighted sum.
Why do the numbers differ from the interim report?
The interim report covered the first 1,002,874 Common Crawl domains; this report covers 3,949,993. Section 5 compares the same range. This report's values take precedence.
Can I check my own site the same way?
Yes. Enter a URL in Site Scouter's server information check to see TLS, HSTS, headers and version disclosure with the same non-intrusive method as this survey.
Was the data altered?
Results are stored in an append-only table, and the aggregation scripts and CSVs are kept in a form that can be recomputed.
References
Last checked: 2026-10-29. Specifications and policies can change; check the primary sources before acting.
- Common Crawl: Web Graphs (domain ranking)
- Tranco: A Research-Oriented Top Sites Ranking
- MDN: Strict-Transport-Security
- MDN: Content-Security-Policy
- PHP: Supported Versions (php.net)
- NVD - National Vulnerability Database (NIST)
- Interim report: World Web Security Survey of 5 Million Sites (Site Scouter)
Yuki Nakazawa(personal blog nkzw.jp)
Contact: Official site / YouTube / Instagram / LinkedIn / X / Telegram